-
Shop
- Advanced Technologies
- AI Skills
- Bathroom
- Best-Sellers
- Car Accessories
- Confidence
- Dating & Social Skills
- Digital Resources
- AI & Technology
- Beauty
- Budgeting & Saving
- Car Buying & Ownership
- Cozy Feast Collection
- Electronics & Technology
- Entrepreneurship & Business Growth
- Financial Education
- Financial Independence
- Financial Mindset & Psychology
- Goal Setting
- Home Styling & Organization
- Kitchen & Recipes
- Leadership
- Mindfulness
- Mindset
- Online Business
- Parenting & Child Development
- Personal Style & Fashion
- Pet Lifestyle & Wellness
- Positive Thinking
- Sleep Improvement
- Smart Life with AI
- Stress Management & Relaxation
- Travel Planning
- Wellness
- Yoga & Fitness
- Yoga & Mind-Body Practices
- Education & Learning
- Family & Parenting
- Fashion
- Accessories
- Alexander McQueen
- Bags
- Bags & Wallets
- Balenciaga
- Belts
- Blazers
- Bottega Veneta
- Bottoms
- Brunello Cucinelli
- Burberry
- Chanel
- Chloé
- Dior
- Dolce & Gabbana
- Dresses
- Etro
- Fendi
- Gucci
- Hats & Hair Accessories
- Hoodies & Sweatshirts
- Jacquemus
- Jewelry
- Jil Sander
- Kiton
- Luggage
- Miu Miu
- Off-White
- Outerwear
- Prada
- Rick Owens
- Saint Laurent
- Shoes
- Socks & Tights
- Sweaters & Cardigans
- The Row
- Tom Ford
- Tops & Shirts
- Valentino
- Valentino Garavani
- Versace
- Vivienne Westwood
- Watches
- Fashion Accessories
- Furniture
- Gadgets
- Health & Beauty
- Health & Wellness
- Home & Garden
- Home Decor
- Home Electronics
- Home Supplies
- Kids & Babies
- Kitchen
- Kitchen Best-Sellers
- Lighting
- Patio, Lawn & Garden
- Personal Growth
- Pet Care
- Pet Supplies
- Pets
- Sport & Outdoors
- Super Deals
- Travel
- Travel & Adventure
- Wealth
- Popular
- Best deals
Track Stock Returns Clearly: Dividends, Gains, Net ROI

Stock Returns Optimization Toolkit: How Money Is Made in Stocks (and How to Track It Clearly)
Making money from stocks is simple in concept—price growth, dividends, and smart tax/fee decisions—but messy in practice when the numbers live in different accounts, statements, and timeframes. Our Stock Returns Optimization Toolkit is built to turn “Am I actually making money?” into a repeatable process: define the return sources, calculate them consistently, and make adjustments that improve the result without guessing.
How people actually get money from investing in stocks
Stock investing pays you in a few core ways, and clarity starts by naming them:
- Price appreciation: you buy shares and later sell them for more than you paid (a realized gain).
- Dividends: cash paid while you hold shares; you can take it as spendable cash or reinvest it.
- Total return: appreciation + dividends (and other distributions), minus costs like fees, spreads, and taxes.
- Unrealized vs. realized: your portfolio value can rise without you taking any money out; “money out” happens through dividends paid as cash and/or selling shares.
- Timeline matters: one great month can hide a weak year; consistent measurement periods keep decisions grounded.
| Return source | How it pays you | What to track |
|---|---|---|
| Price appreciation | Sell shares above purchase price | Cost basis, sale price, holding period |
| Dividends | Cash distributions or reinvested shares | Dividend yield, payout history, reinvestment |
| Total return | Combined outcome over time | Performance net of fees and taxes |
If you want deeper background on the basics of investing, dividends, and capital gains, these references are helpful: Investor.gov (SEC) — Investing Basics, FINRA — Dividends, and IRS — Capital Gains and Losses.
A clear path from “portfolio value” to “money in your pocket”
Portfolio value is a snapshot; money in your pocket is a cash flow story. Our team uses this sequence to connect the two:
- Step 1 — Define the goal: income now (dividends), growth later (appreciation), or a blend.
- Step 2 — Separate performance from contributions: deposits and withdrawals are cash movement, not investment return.
- Step 3 — Choose the return lens per account: time-weighted return to compare a strategy/manager; money-weighted return when the timing of deposits and withdrawals is part of the result.
- Step 4 — Map the cash exits: dividends paid out, shares sold, and any transfers to checking or a goal account.
- Step 5 — Track net results: when you compare what to keep, change, or sell, use after-fee and after-tax numbers.
Cash flow checklist (what to record every time)
| Event | What happens | What to record |
|---|---|---|
| Deposit | Adds capital, not return | Date and amount |
| Dividend paid | Creates income or reinvested shares | Cash received or reinvested amount |
| Sell shares | Realizes gain/loss and creates cash | Proceeds, cost basis, taxes/fees |
| Withdrawal | Moves money out of the portfolio | Date and amount |
Where the Stock Returns Optimization Toolkit fits
When your numbers are scattered—multiple brokers, taxable plus retirement accounts, dividends reinvesting in the background—it’s easy to default to “headline performance” and miss what’s actually happening net of costs. The Stock Returns Optimization Toolkit is designed to give you a structured cadence: calculate consistently, review on schedule, and adjust only what you can control.
- Built for action: one method to calculate, review, and improve returns without relying on disconnected statements.
- Focuses on controllables: position sizing rules, rebalancing cadence, dividend handling, and cost discipline.
- Reduces period bias: consistent time windows so one hot stretch doesn’t distort the plan.
- Supports decisions: hold, trim, add, or exit based on results you can verify.
Toolkit-driven review rhythm
- Weekly: note major moves, volatility, and position drift so your next adjustment is deliberate.
- Monthly: close out contributions, dividends, and realized trades into a clean snapshot.
- Quarterly: check allocation targets, concentration risk, and fee drag; rebalance with rules.
- Annually: reconcile taxes, long-term performance, and strategy fit; update your rules for the next year.
Optimization levers that often matter more than “finding the next winner”
Better outcomes frequently come from tightening the process, not swinging for miracle picks:
A simple worksheet-style framework you can run monthly
Helpful resources from our store
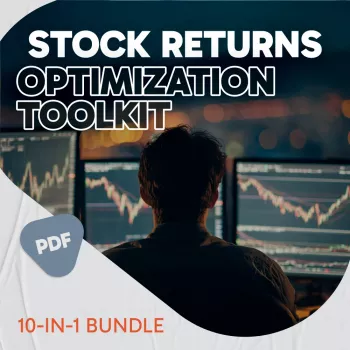
- Stock Returns Optimization Toolkit | how do you get money from investing in stocks — our structured system for tracking return sources and improving net outcomes.
- AI for Small Business Toolkit – 5-in-1 Digital Download Bundle — useful if you want help automating summaries, checklists, and repeatable monthly review notes across your finances and operations.
- Choosing the Right Payment Solution for Your Business: Stripe vs Square Which Is Better – Complete eBook Guide for Small Business Owners — a practical guide for business owners who want clearer fee math and cleaner decision-making on payment costs.
FAQ
How do you actually get money from stocks without selling?
You get money without selling through dividends and fund distributions paid to you as cash. If dividends are reinvested, you’re still being paid, but the cash is used to buy more shares; appreciation itself remains unrealized until you sell.
What’s the difference between total return and profit?
Total return covers price change plus dividends and distributions over a specific period, and it can be measured before or after fees and taxes. Profit often refers to realized gains after selling and may overlook dividends, fees, and taxes unless you track them explicitly.
How can returns be optimized without taking more risk?
You can optimize by improving controllables: reducing fees and spreads, increasing tax efficiency, rebalancing with rules, and limiting concentration so one position doesn’t dominate outcomes. The key is measuring net results (after-fee, after-tax) over consistent time windows so changes are verifiable.
Recommended for you


3-3-3 Rule for Toddlers: Calm Big Feelings Fast
Oct 13, 2026













Leave a comment